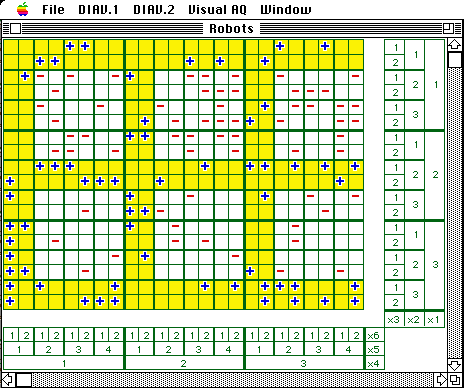
a diagrammatic visualization of data mining and machine learning processes (knowledge visualizer – KV)
(Michalski, Szymacha, Sniezynski, Vang, Zhang, Wnek)
The KV project concerns the development of a system for visualizing data mining, machine learning and knowledge discovery processes involving discrete multi-dimensional functions. It employs a planar model of a discrete multidimensional space, called generalized logic diagram or GLD, proposed by Michalski (1978). The diagram is spanned over a set of discrete attributes and consists of cells, each representing one unique combination of attribute values (a vector of attribute values). Thus, there are as many cells as there are possible vectors of attribute values. To determine the cell corresponding to a given vector, one seeks the intersection of the areas corresponding to the values of individual attributes.
For example, in the diagram below, the top-left cell represents the vector:
(x1 = 1, x2 = 1, x3 = 1, x4 = 1, x5 = 1, x6 = 1).

In the diagram above, Positive examples of a concept are visualized using “+”, counter-examples of the concept are visualized using “-“. A decision rule (a conjuction of conditions on attribute values) corresponds to regular arrangement of cells that can be easily recognized visually. A concept description is in the form of a collection of such decision rules (a ruleset). For example, the yellow area in the diagram represents a concept desciption described by the disjunction of two rules:
R1: [x5 = 1]
R2: [x1 = x2]
If the target and learned concepts are represented in the diagram, then their set-difference denotes errors in the learned concept (“error area”).
The diagram can also illustrate results of any operation on the concept, such as generalization or specialization, or any change of the description space, such as adding or deleting attributes, or their values. Another interesting feature is that it can also visualize concepts acquired by non-symbolic systems, such as neural nets or genetic algorithms. Using the diagram one can directly express the learned concepts in the form of decision rules. Thus, the diagram allows one to evaluate both the quality and the complexity of the results of symbolic, as well as non-symbolic learning.
We have implemented two systems: DIAV-2 in Smalltalk, and KV in Java. These systems can display description spaces with up to one million events, i.e., spaces spanned over up to 20 binary variables (or a correspondingly smaller number of multiple-valued variables). The systems have proven to be very useful for analyzing behavior of learning algorithms. They are available to universities and industrial organizations.
Selected References
Zhang, Q. “Knowledge Visualizer User’s Guide,” Reports of the Machine Learning and Inference Laboratory, George Mason University, Fairfax, VA, 1997.
Wnek, J., “DIAV 2.0 User Manual: Specification and Guide through the Diagrammatic Visualization System,” Reports of the Machine Learning and Inference Laboratory, MLI 95-5, George Mason University, Fairfax, VA, 1995.
Michalski, R.S. and Wnek, J., “Learning Hybrid Descriptions,” Proceedings of the 4th International Symposium on Intelligent Information Systems, Augustow, Poland, June 5-9, 1995.
Wnek, J., Kaufman, K., Bloedorn, E. and Michalski, R.S., “Selective Induction Learning System AQ15c: The Method and User’s Guide,” Reports of the Machine Learning and Inference Laboratory, MLI 95-4, George Mason University, Fairfax, VA, March 1995.
Wnek, J. and Michalski, R.S., “Discovering Representation Space Transformations for Learning Concept Descriptions Combining DNF and M-of-N Rules,” Working Notes of the ML-COLT’94 Workshop on Constructive Induction and Change of Representation, New Brunswick, NJ, July 1994.
Wnek, J. and Michalski, R.S., “Conceptual Transition from Logic to Arithmetic,” Reports of the Machine Learning and Inference Laboratory, MLI 94-7, Center for Machine Learning and Inference, George Mason University, Fairfax, VA, December 1994.
Wnek, J. and Michalski, R.S., “Hypothesis-driven Constructive Induction in AQ17-HCI: A Method and Experiments,” Machine Learning, Vol. 14, No. 2, pp. 139-168, 1994.
Wnek, J. and Michalski, R.S., “Comparing Symbolic and Subsymbolic Learning: Three Studies,” in Machine Learning: A Multistrategy Approach, Vol. 4., R.S. Michalski and G. Tecuci (Eds.), Morgan Kaufmann, San Mateo, CA, 1994.
Wnek, J., Hypothesis-driven Constructive Induction, Ph.D. dissertation, School of Information Technology and Engineering, Reports of Machine Learning and Inference Laboratory, MLI 93-2, Center for Artificial Intelligence, George Mason University, (also published by University Microfilms Int., Ann Arbor, MI), March 1993.
Wnek, J., Sarma, J., Wahab, A. and Michalski, R.S., “Comparing Learning Paradigms via Diagrammatic Visualization: A Case Study in Concept Learning Using Symbolic, Neural Net and Genetic Algorithm Methods,” Proceedings of the 5th International Symposium on Methodologies for Intelligent Systems – ISMIS’90, Knoxville, TN, pp. 428-437, October 1990.
Michalski, R.S., “A Planar Geometric Model for Representing Multi-dimensional Discrete Spaces and Multiple-valued Logic Functions,” Reports of Computer Science Department , Report No. 897, University of Illinois, Urbana, IL, January 1978.
For more references, see publications section.
